Master the Freight Market:
While Xeneta’s focus is on long-term contracts and static data, Terminal insights are based on live transactional market data, offering real-time information for reliable decision making, problem solving and risk management required by modern logistics.
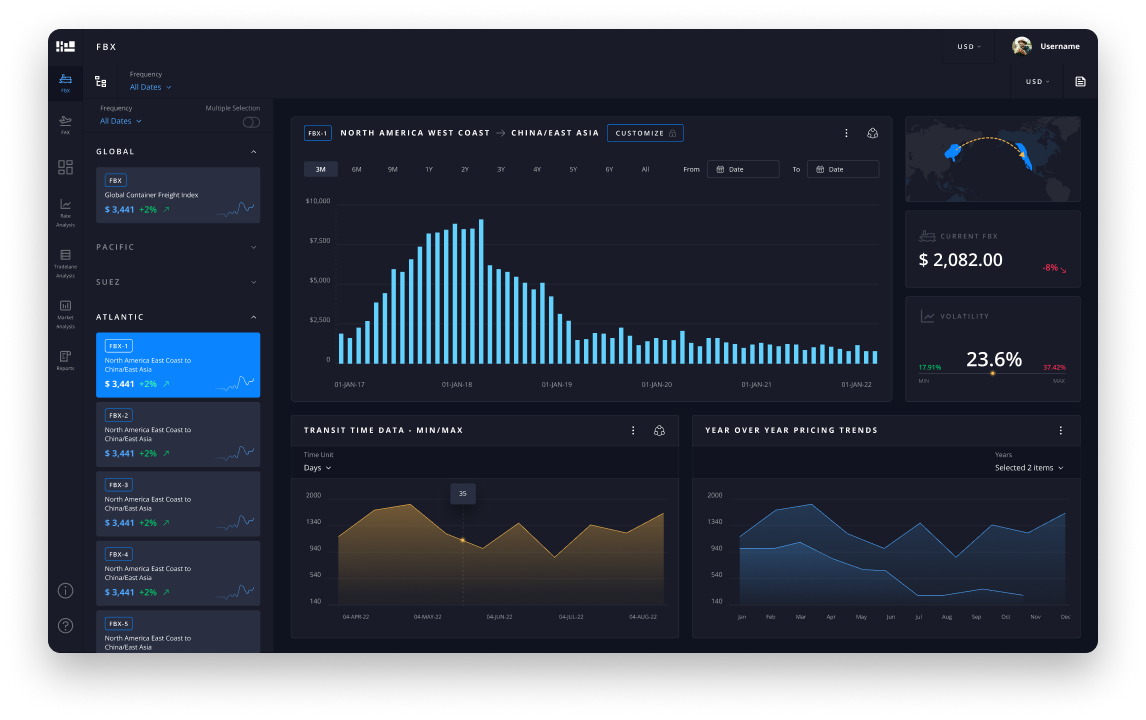
Unparalleled real-time data stream that keeps supply chains flowing smoothly
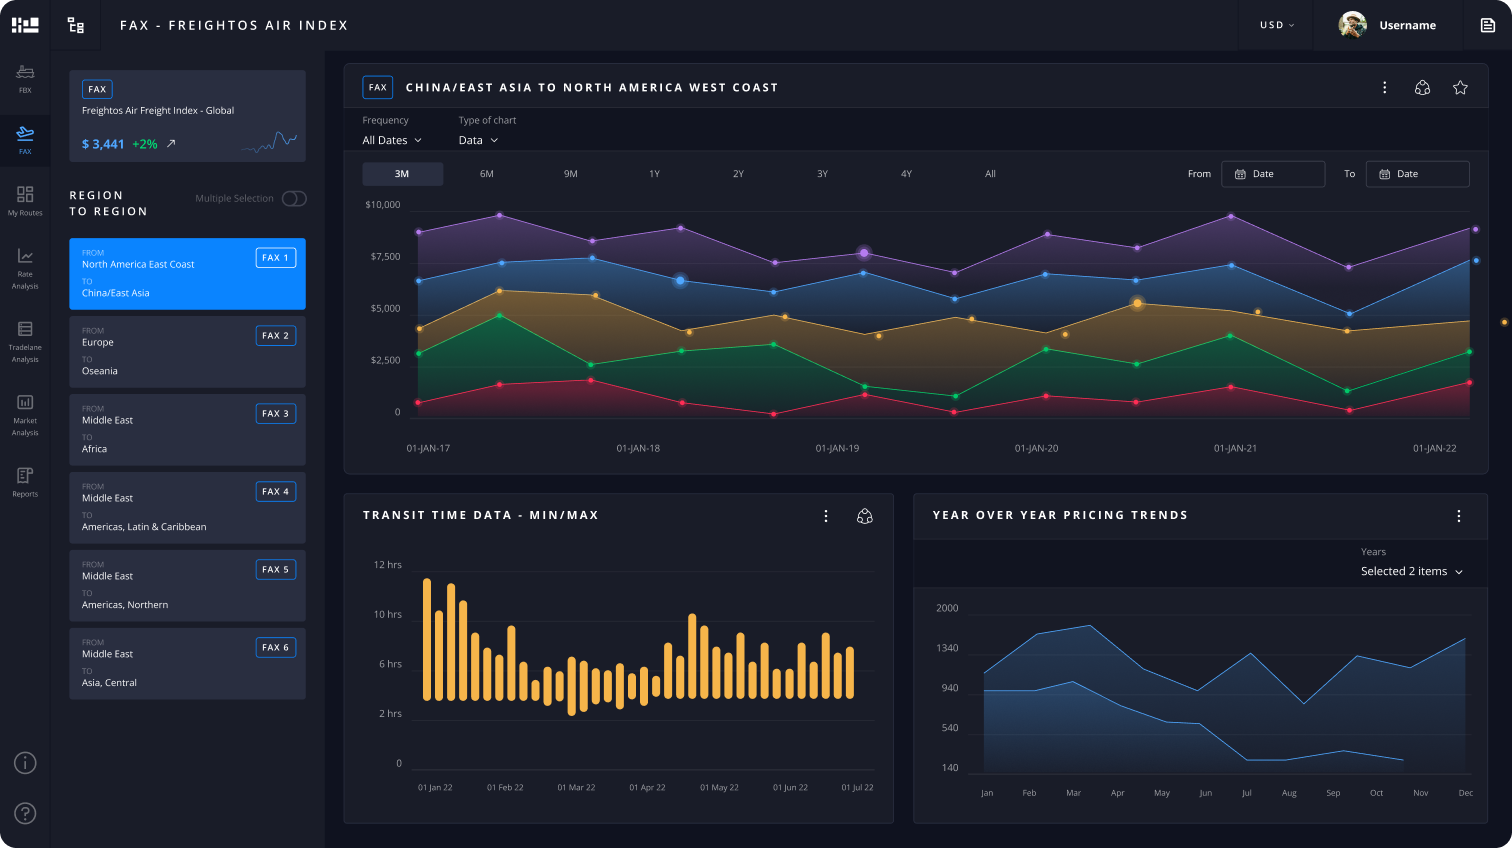
Real-time air and ocean market intelligence, context in the form of market-moving events, benchmarking and more
Track prices changes and make timely decisions to improve business efficiency
Dive into daily pricing updates aggregated from top providers – for a fraction of the price.


Freightos Terminal isn’t just a product — it’s a complete solution for today’s modern supply chain needs.
With real-time commercial data, port-to-port air and ocean insights, live market updates, spot and contract rate benchmarking, AI-generated summaries, and supported by daily updated benchmarks like the Freightos Air Index and Freightos Baltic Index, it redefines efficiency.
“A true north for us to understand if we were being competitive with the market”

Logistics Manager, Briggs & Stratton
"We love the data! Freightos is our personal favorite on my team."
Revenue Strategy Manager UPS
“...volatile air freight markets during the pandemic showed once again how important it is to have transparency on market developments”
Head of Global Warehouse & Transport for Divisions Pharmaceuticals and Consumer Health Bayer
Fueled by over 2 billion price points and 150 million new monthly data points, Terminal offers granular insights on lane-specific pricing, transit times, and reliability metrics, with real-time contextual event updates via AI chat and bespoke reports.
Leverage AI natural language chat for up-to-date event feeds, combined with automatically generated bespoke reports for updating internal and external stakeholders
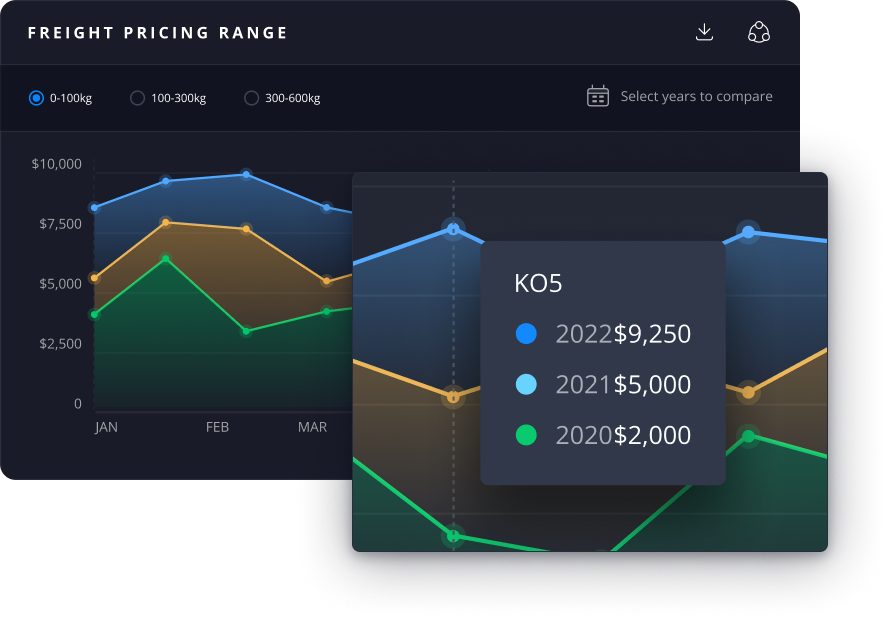
Deep data analysis with weight breaks, port pair varieties, self-generated lanes and more.
Access real-time, daily data sourced from anonymized near-real-time contractual data, supported by 25-100 analyst updates daily and live feeds from various sources.
Gain direct API-enabled access to real-time, actionable data, including vital updates on weather, holidays, and labor disputes.
Navigate global freight data with confidence – and transparency.
Is it free?
A free version of Freightos Terminal is available here. The free plan includes weekly data on the flagship container index and the 12 additional lanes (going back 3 months), ability to download charts, week-on-week price changes and indicators of pricing volatility, as well as year-on-year pricing changes for FAX.
How does pricing work?
We offer a number of different data offerings, depending on granularity of data, frequency, additional data points like transit time or reliability, market feeds, historical data, and more. Request a demo or view the pricing page for more information.
HOW IS FREIGHTOS BALTIC INDEX DATA CALCULATED?
Prices used in the index are rolling short term Freight All Kind (FAK) spot tariffs and related surcharges between carriers, freight forwarders and high-volume shippers. Index values are calculated by taking the median price for all prices (to ignore the influence of outliers on active lanes) with weighting by carrier. 50 to 70 million price points are collected every month. The daily freight rate index is published in a “sliding window” containing the relevant data that are effective and not expired from 00:00 UTC on the day before publication to 24:00 UTC on the day of publication, meaning 48 hours in total starting from 00:00 yesterday. Only rates created or modified within the last 3 months and valid during those 48 hours will be included (in practice on most trade lanes rates are volatile and almost all rates are much newer than 3 months). Rates are calculated at 06:00 UTC and published at 14:00 UTC. The weekly freight index is calculated as an average of the five business days from the same week and published each Friday.
How fresh is the data?
Join thousands of top-tier companies getting FBX updates directly to their inbox.