The FBX03 global ocean freight container pricing index measures 40′ container prices across key port pairs from China or East Asia to North America’s East Coast. This index is created and maintained in collaboration with the Baltic Exchange. Key ports in the index include New York (NYC) and Houston (HOU) in the United States and Shanghai (PVG) and Ningbo (NGB) in China.
Common goods shipped on this trade lane include high-value goods, luxury items, and perishable goods like seafood.
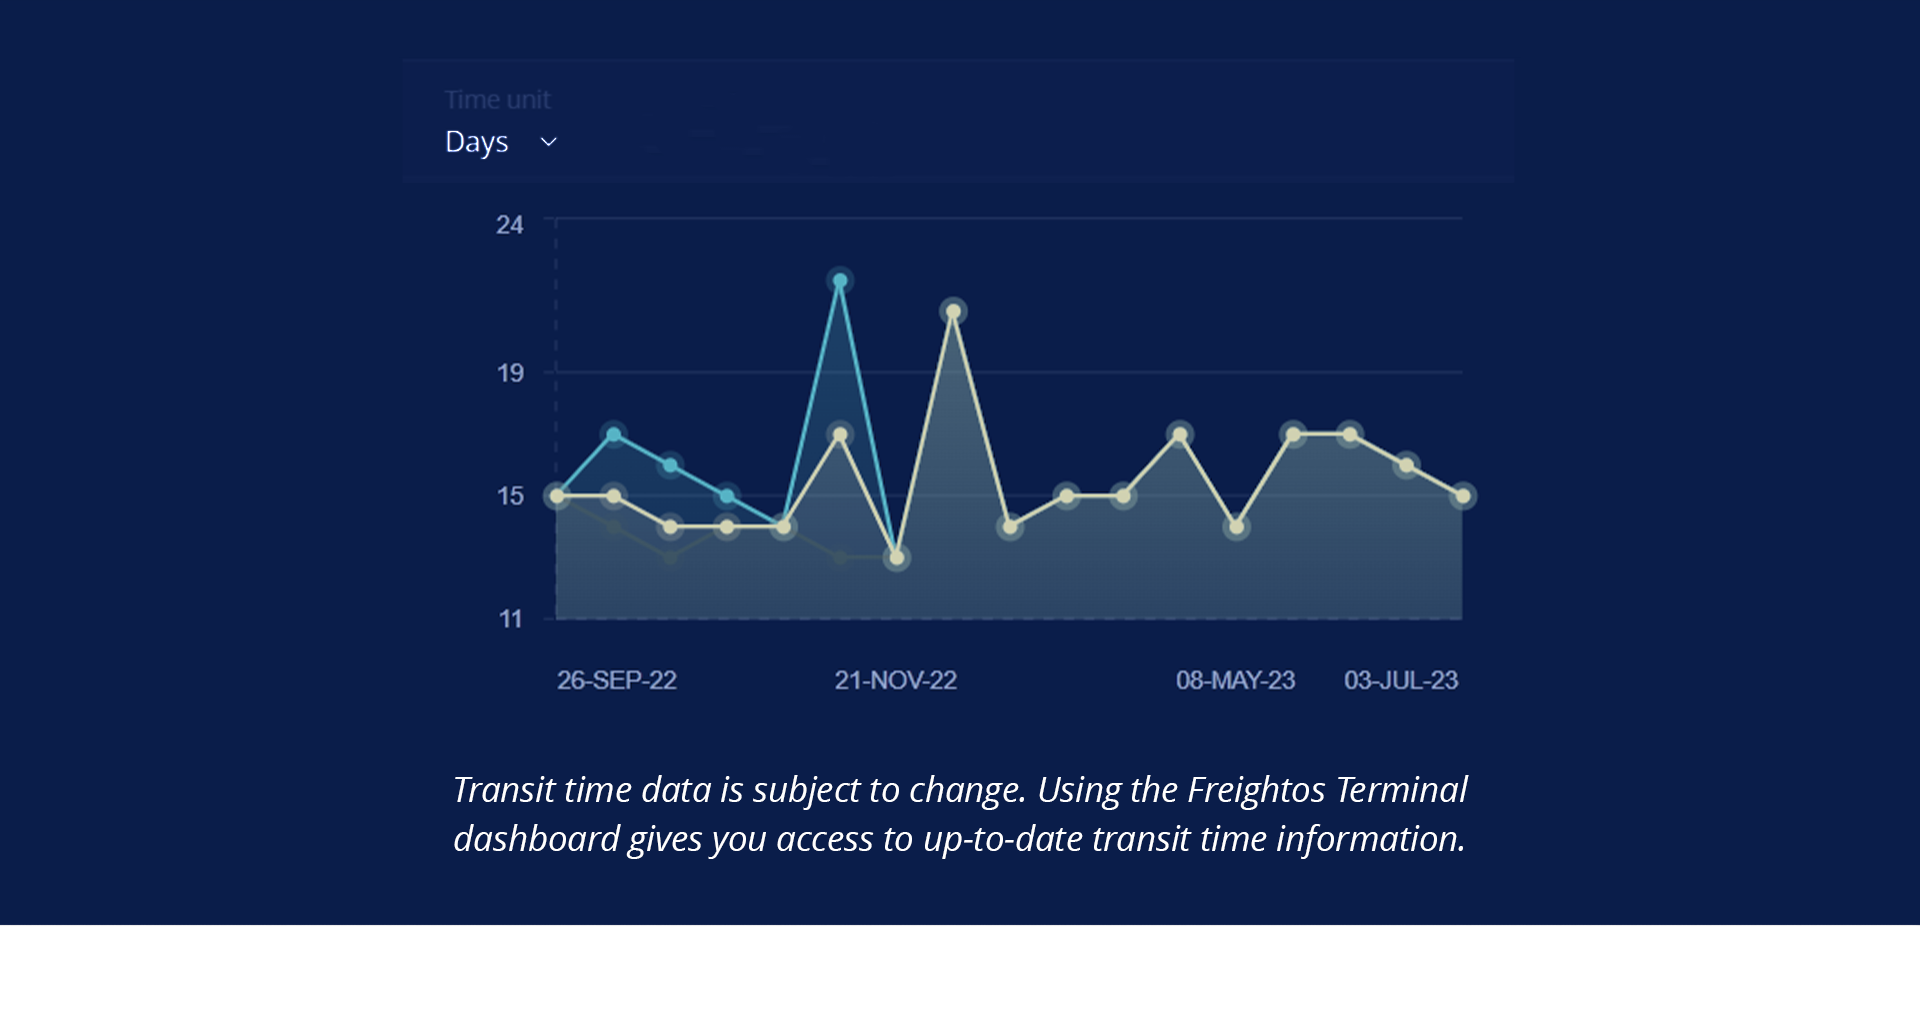
Current FBX
Volatility
Public holiday Easter Monday in Hong Kong.
Hong Kong is experiencing a significant decline in cargo throughput as shipping alliances increasingly bypass the port in favor of larger hubs.
Port of Baltimore authorities announce plans to start recovery efforts by opening a temporary channel to allow passage of some ships to the port, though the dimensions will not accommodate large vessels like container ships.
Join 40,000 logistic professionals staying in-the-know with our weekly email updates
Which ports are included in FBX03?
| China/East Asia Ports: | North American East Coast ports: |
| CNNGB – Ningbo CNSHA – Shanghai CNYTN – Yantian HKHKG – Hong Kong JPUKB – Kobe KRPUS – Busan S. Korea SGSIN – Singapore TWKHH – Kaohsiung Taiwan VNVUT – Vung Tau |
USBAL – Baltimore USCHS – Charleston USEWR – Newark USHOU – Houston USNYC – New York USORF – Norfolk/Virginia USSAV – Savannah |
How is FBX03 calculated?
Prices used in the index are rolling short term Freight All Kind (FAK) spot tariffs and related surcharges between carriers, freight forwarders and high-volume shippers. Index values are calculated by taking the median price for all prices (to ignore the influence of outliers on active lanes) with weighting by carrier. 50 to 70 million price points are collected every month. The daily freight rate index is published in a “sliding window” containing the relevant data that are effective and not expired from 00:00 UTC on the day before publication to 24:00 UTC on the day of publication, meaning 48 hours in total starting from 00:00 yesterday. Only rates created or modified within the last 3 months and valid during those 48 hours will be included (in practice on most trade lanes rates are volatile and almost all rates are much newer than 3 months). Rates are calculated at 06:00 UTC and published at 14:00 UTC. The weekly freight index is calculated as an average of the five business days from the same week and published each Friday.
Which other trade lanes does FBX cover?
Can I source FBX03 data?
FBX data is available to subscribers on the Freightos website and via Thomson Reuters Eikon or Bloomberg screens. It is also updated weekly on the JOC’s Market Data portal, pulled weekly into TI Insight’s GSCi market intelligence platform. Besides viewing charts, you can download csv files or png charts. If you are a journalist, analyst, or armchair logistics buff, contact [email protected] if you’re interested in a CSV version of data.